Retail / AI Automation Dashboard

Retail & E-commerce
Analytics

How an international retail brand reduced weekly report preparation from 6 hours to 3 seconds by implementing local on-the-fly data processing.

Case Summary

What it is
Web application for retail sales analytics
Client
International premium textile brand
Result
Report in 3 seconds instead of 4–6 hours of manual work
Technologies
React 19, TypeScript, XLSX streaming, Google Gemini Pro
Security
Client-side — data never leaves the browser
Launch time
from 3 weeks

The Old Approach Barrier

Analytics turned into routine. Hundreds of tables, human error, and inevitable delays.

error_outline

4–6 hours of routine weekly

A brand with a wide range of premium textile products had raw, fragmented data in exports from internal systems. Analysts assembled reports manually.

The result: constant VLOOKUP searches, aligning tens of thousands of rows, and inevitable 'broken' names distorting the metrics of the entire department.

group

Analysts

  • closeManual data cleaning
  • closeRisk of SKU typos
  • close4–6 hours per report
trending_down

Management

  • closeLate management decisions
  • closeNo trust in data accuracy
  • closeData delay up to 7 days
0
Automation
0
Data Processing
0
Logic Rules

Local Solution

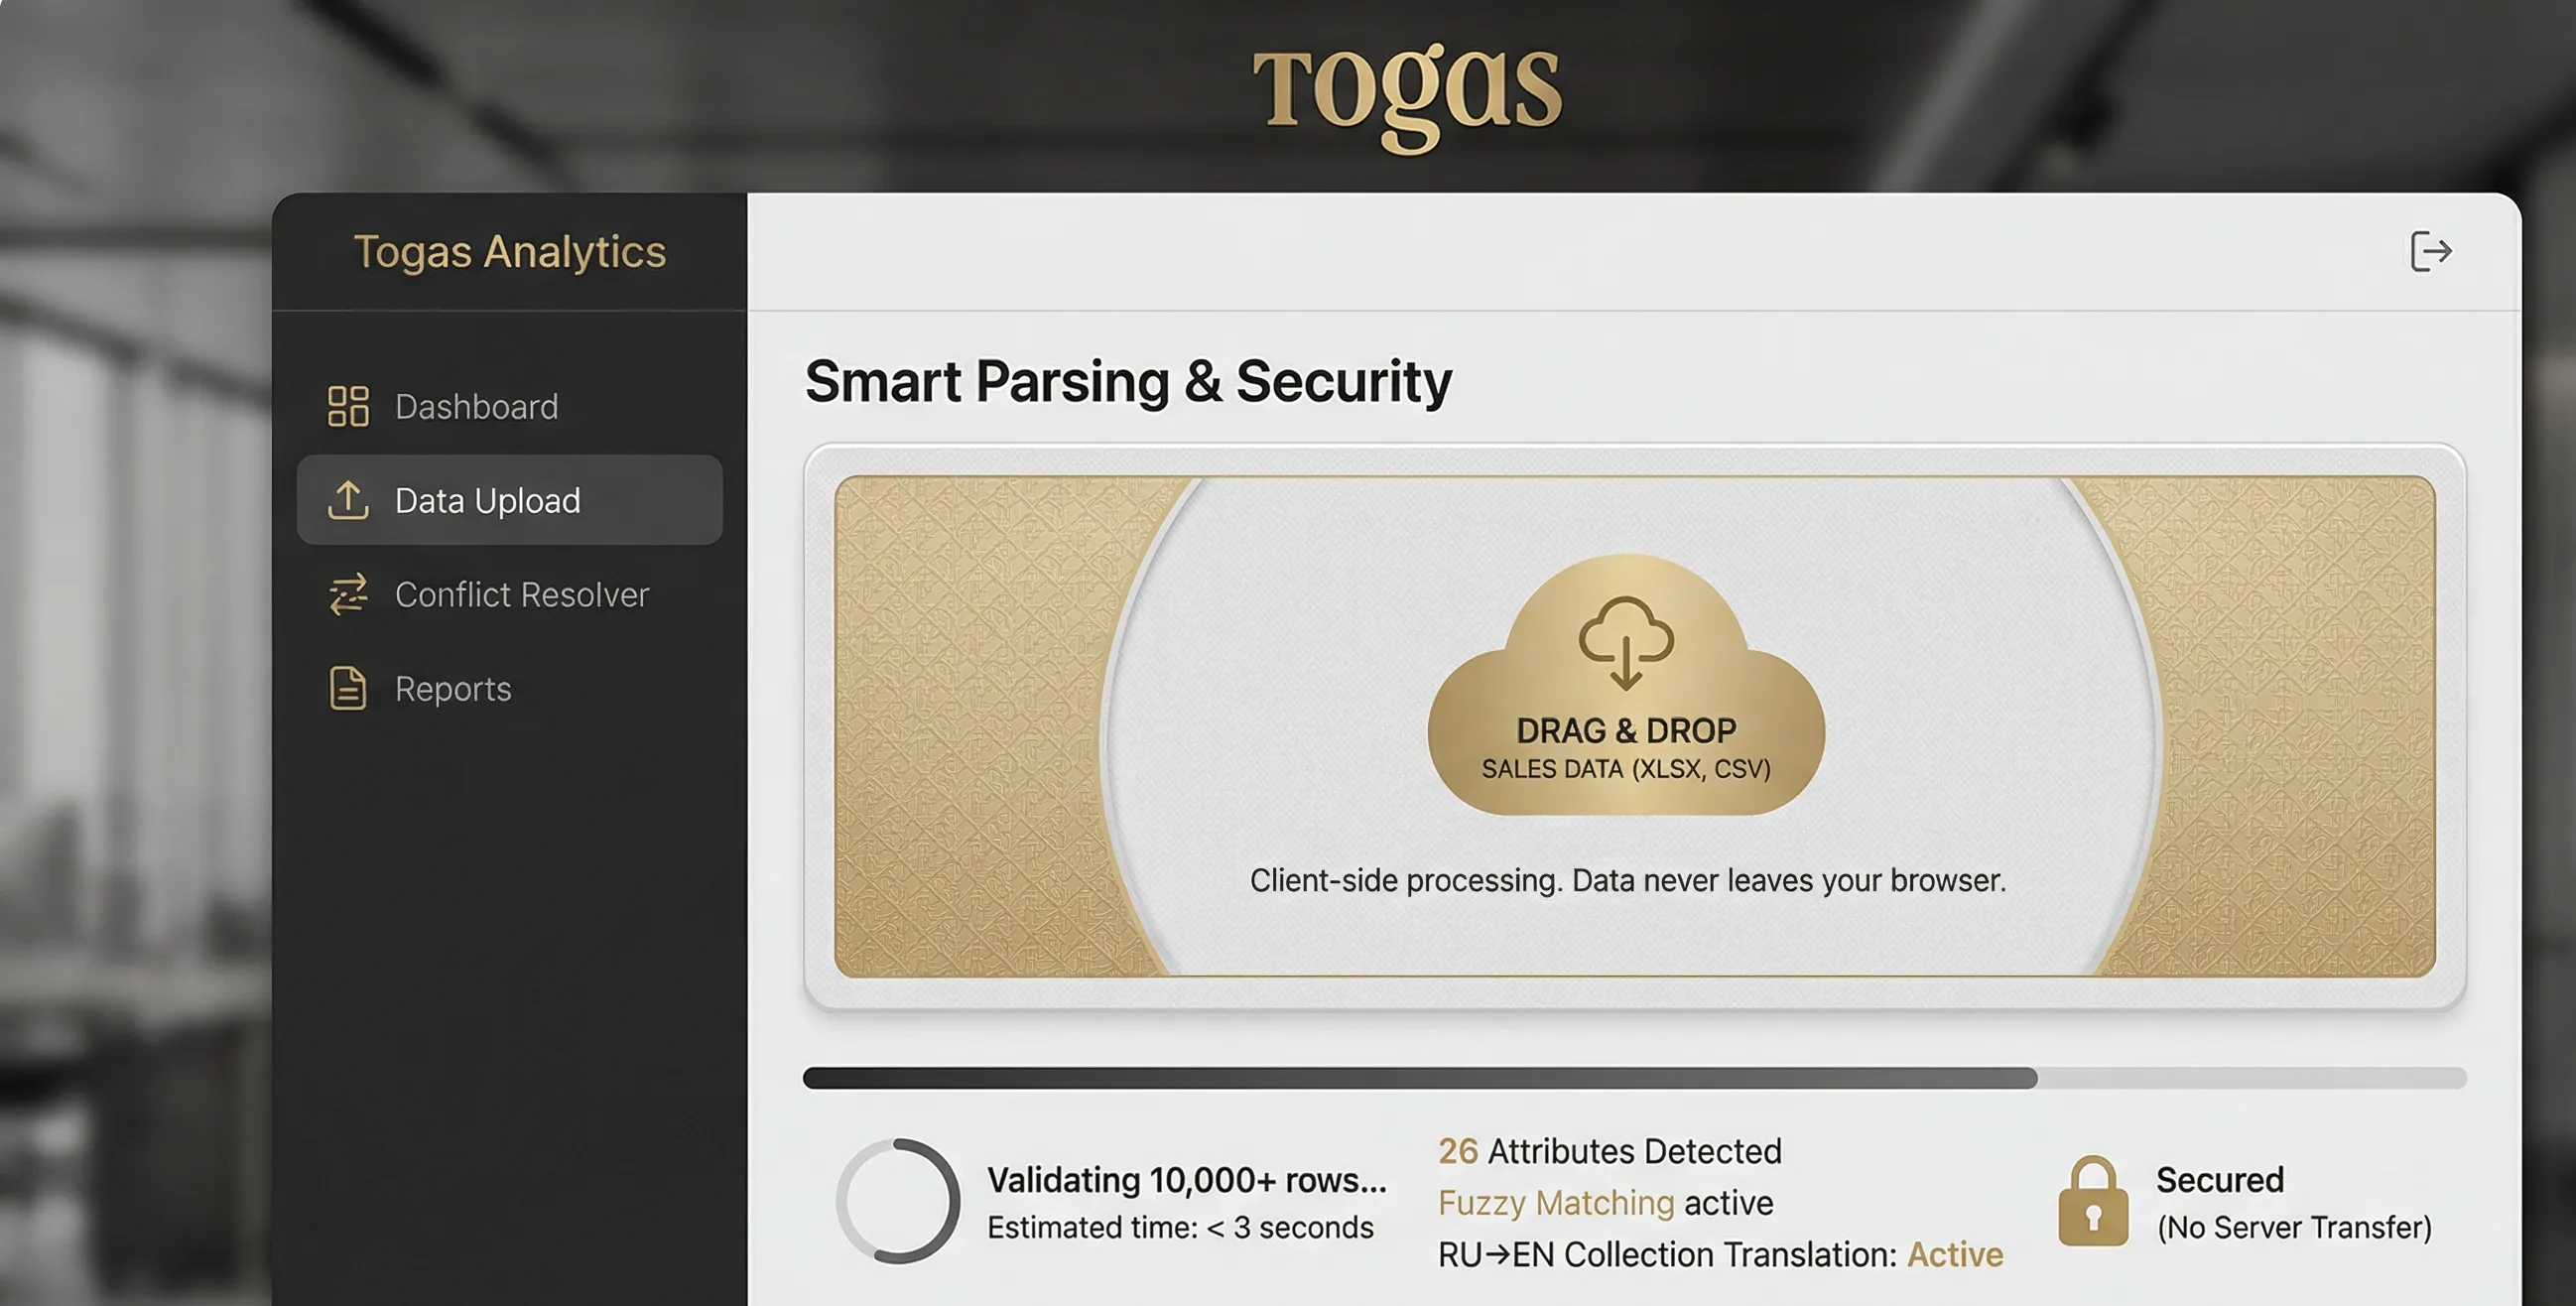
Web application for automatic sales processing. Secure streaming from Master Data directly in the browser, without sending to a backend.

psychology
Smart Parsing

Surgical SKU parsing

Recognizes 26 SKU attributes from raw tables. Normalizes colors, sizes, and automatically translates collections RU → EN on the fly.

shield

Strict Protection

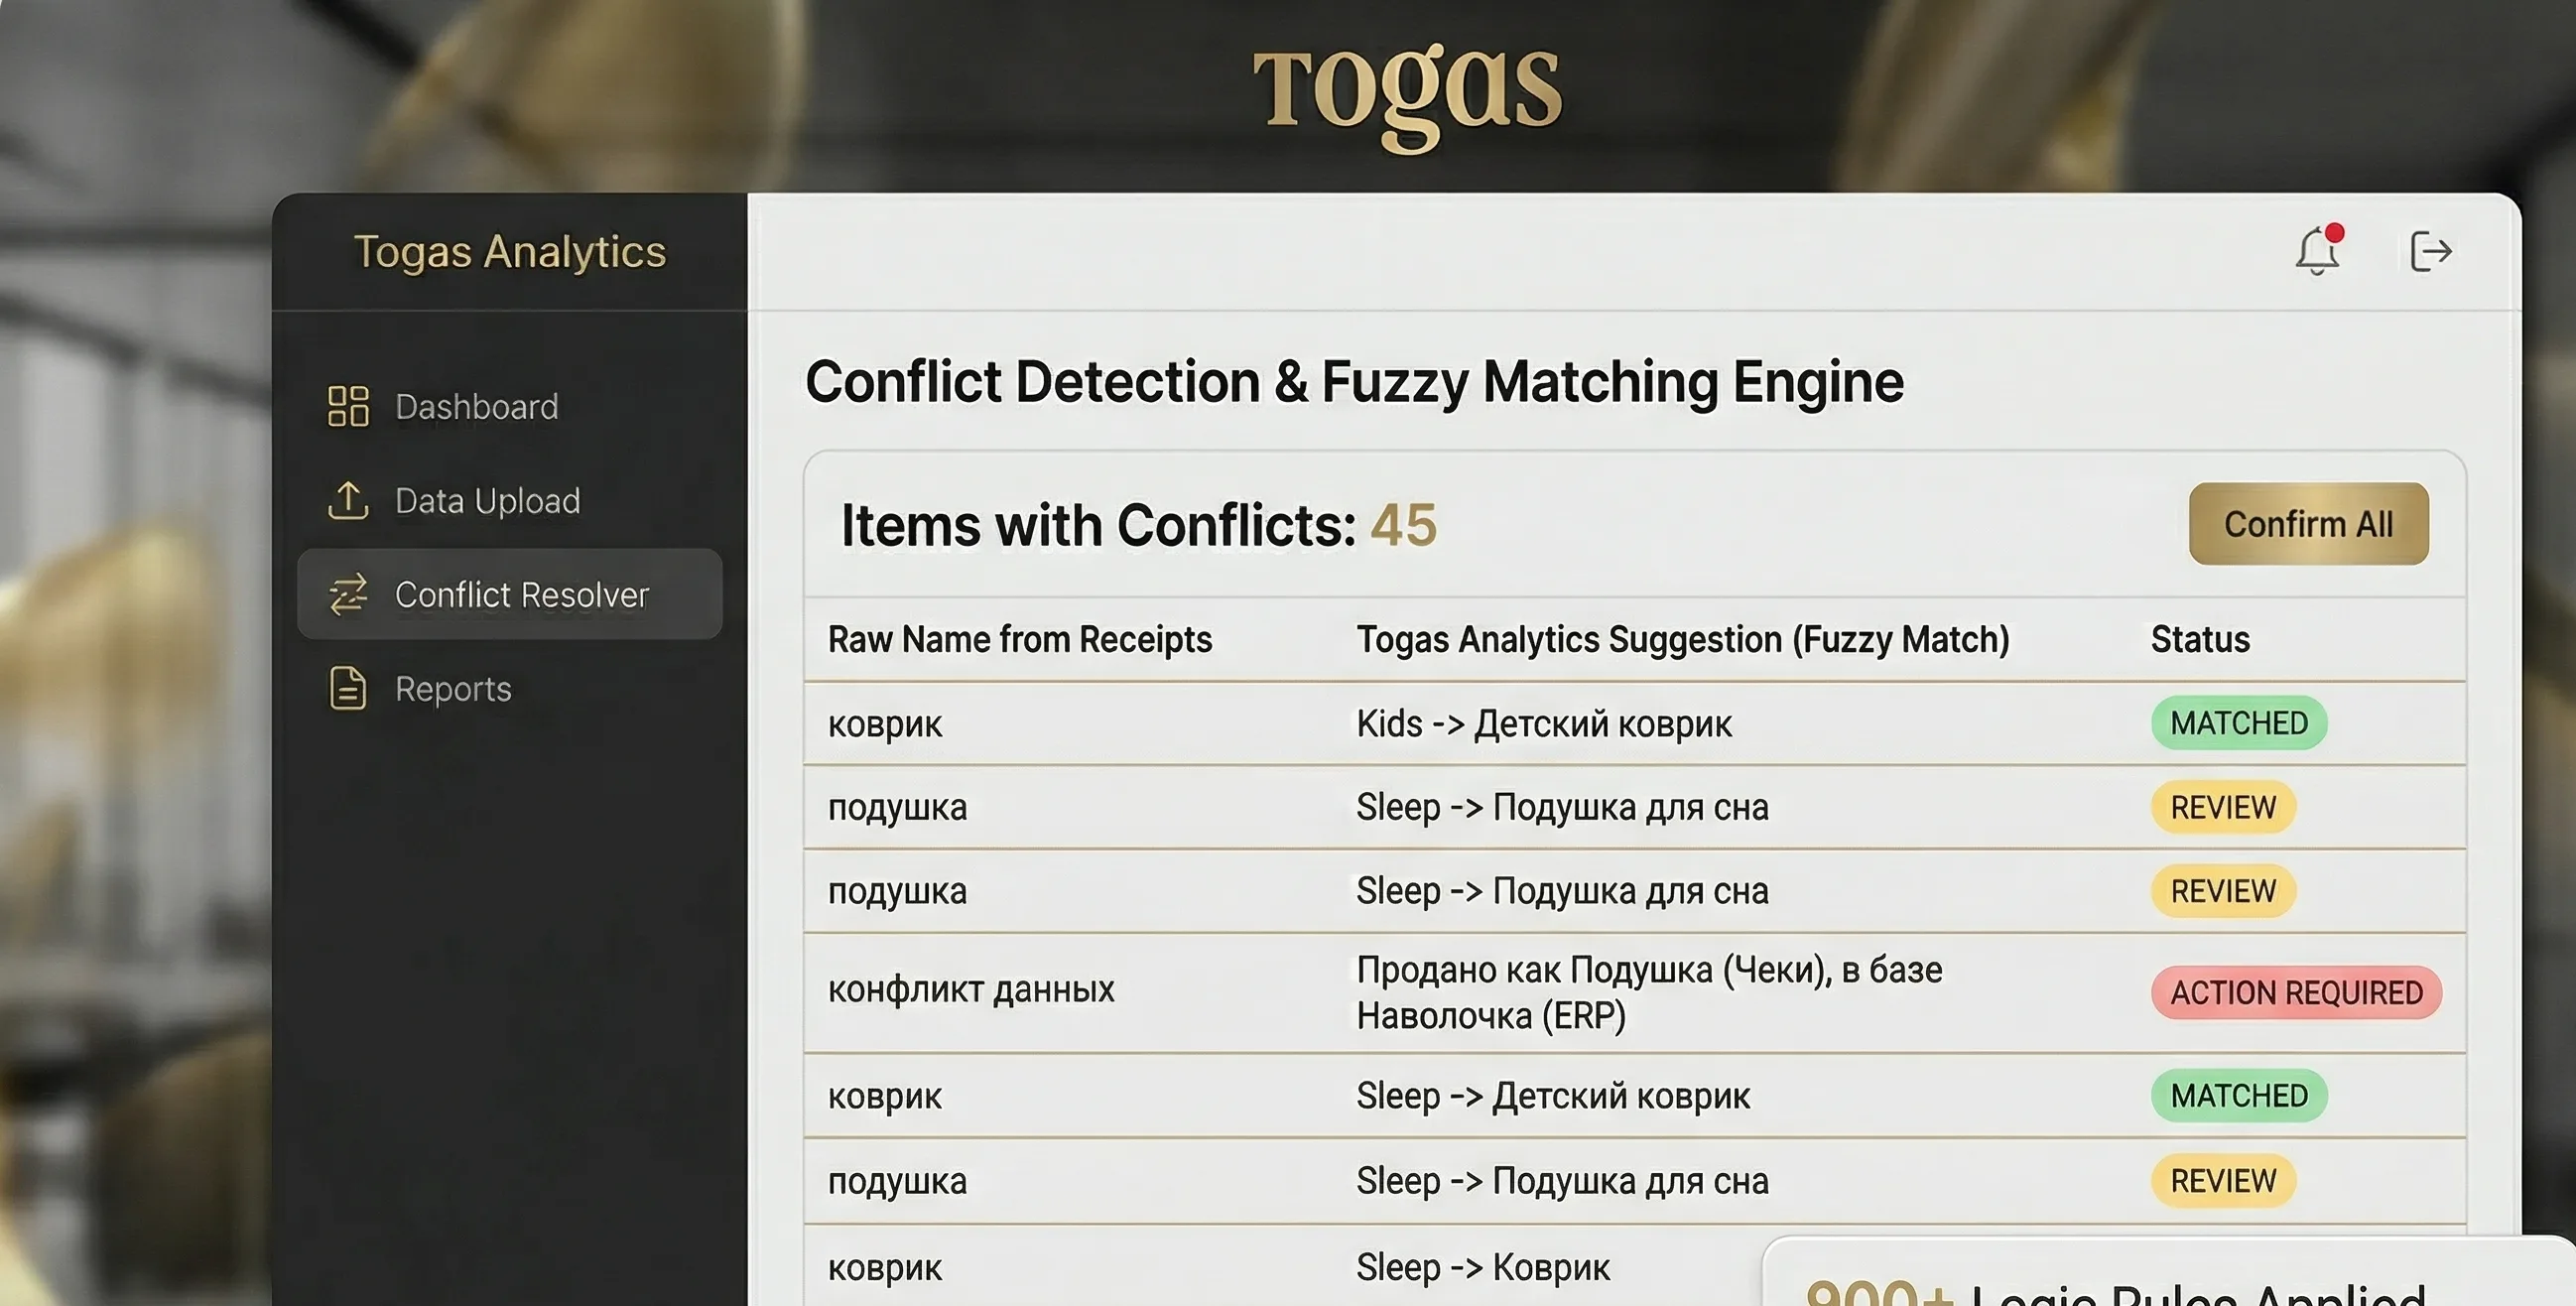
Multi-factor logic. For example: a 'Rug' with parameters of a 'baby crib' automatically goes to the Kids category.

join_inner

Fuzzy Matching

Complex fuzzy name matching against the master catalog (99% accuracy) to prevent duplicates and report losses.

auto_awesome
Gemini Pro API

AI Sales Summarization

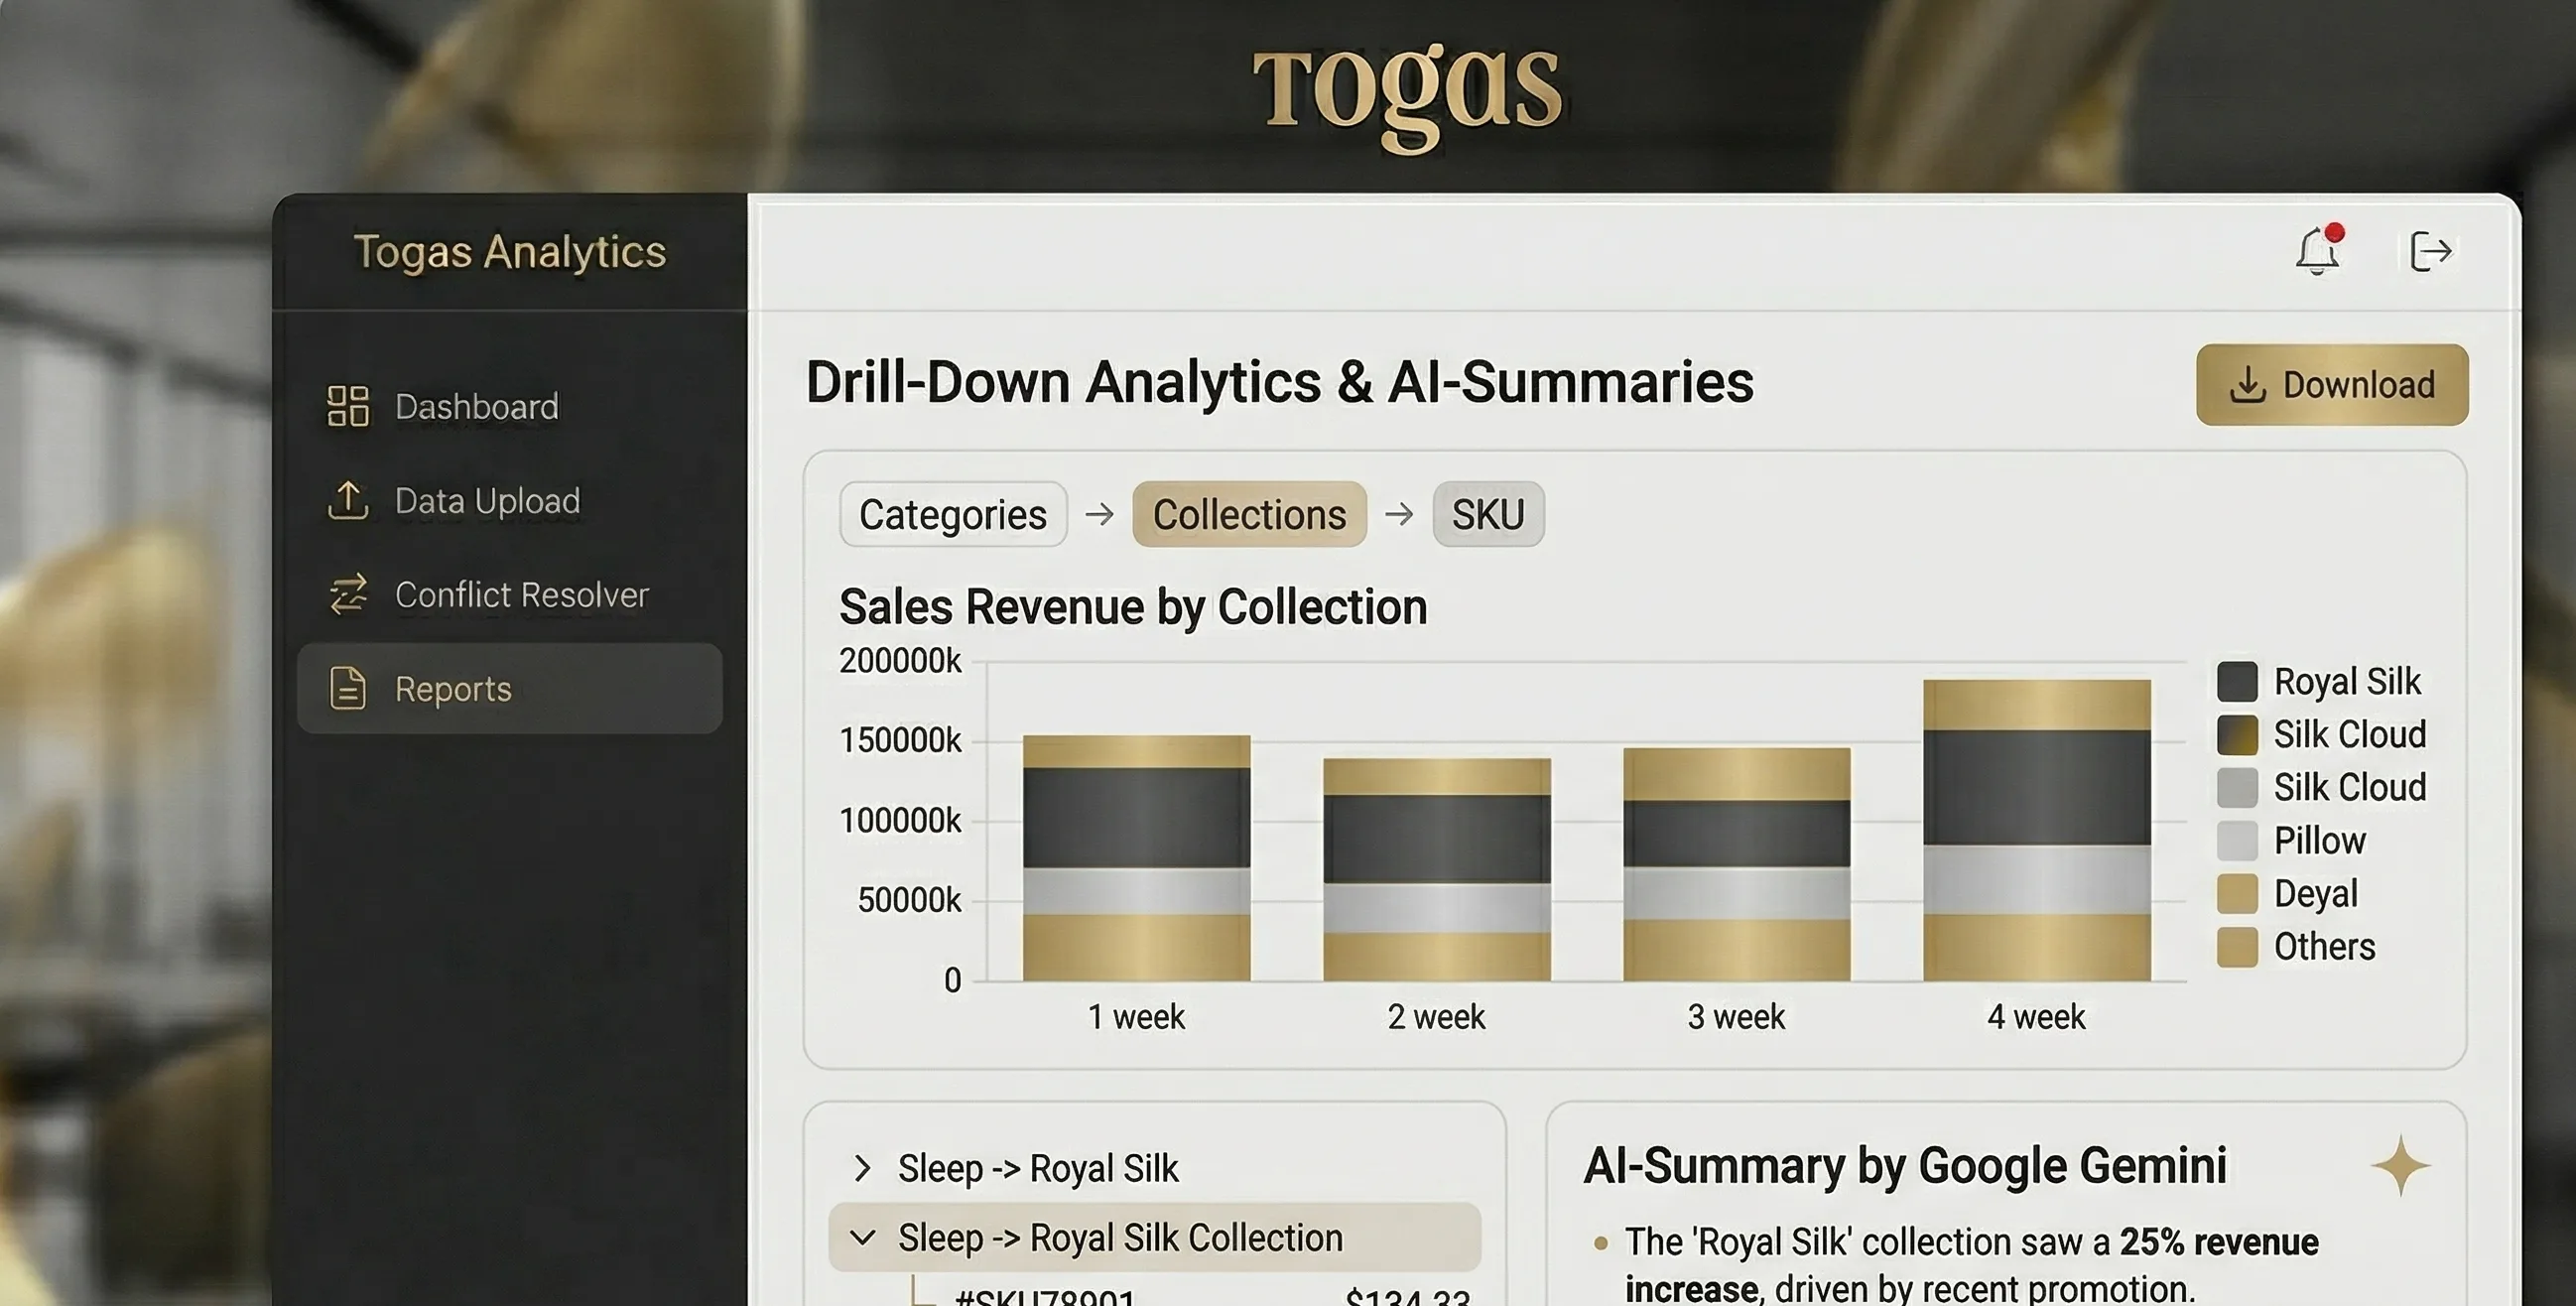
LLM integration to generate text summaries of key insights: anomalous drops, bestsellers, and returns as text for the CEO.

format_quote

"The hardest part was teaching the system to 'think' like a category manager. We wrote more than 900 lines of logic just to handle the nuances of the product catalog, so the system would understand the difference between a 'Decorative Pillowcase' and a 'Sleeping Pillowcase' better than the Excel user himself."

person
Yevhen Katkov
CTO, Aibot.pro

Deep Dive
into the System Interface

1 Data Upload

The data file is loaded into the browser. The system instantly confirms the start of data processing and validates the file.

2 Smart Categorization

Metrics summary recalculates instantly: from total sales and conversion to category anomalies.

3 Analytics & AI Insights

Ready report. The engine processes 10,000+ rows in less than 2 seconds directly in the browser. Elimination of human error.

upload-zone.ui
Excel file upload interface in Togas Analytics system — drag-and-drop zone for Master Data export
dashboard.ui
Togas Analytics main dashboard — smart SKU categorization and retail brand sales analytics in real time
ai-settings.ui
Togas Analytics AI module settings — Gemini Pro logic management and SKU parsing rules

Key Advantages

We focused on speed, autonomy, and security (Zero Trust Data).

speed

Ultra-high speed

10,000+ rows of data processed in less than 2 seconds directly in the browser. You no longer wait for reports to load — everything works instantly.

security

Client-Side

All processing is done on the client side. Files with commercial data never leave your browser.

palette

Luxury UX

Interface with a strict premium design system with instant data validation (Instant Feedback).

account_tree

900+ lines of protective logic

The system determines the product category on its own, relying not only on the direct name, but also on hidden indirect signs from 26 SKU attributes, guaranteeing 100% accuracy.

Technologies Under the Hood

React React
TypeScript TypeScript
bolt Vite
Tailwind Tailwind CSS
table_chart XLSX (streaming)
join_inner Fuzzy Matching
auto_awesome Google Gemini API

Implementation Results

query_stats
query_stats

For Analysts

  • timer Report time: from 4–6 hours → 3 seconds
  • dataset Processing 10,000+ rows: less than 2 seconds
  • block Manual VLOOKUP formats: completely eliminated
  • bug_report Nomenclature conflicts: detected automatically
supervisor_account
supervisor_account

For Management

  • check_circle Sales report ready immediately after database export
  • verified_user Data accuracy: 900+ lines of protective logic
  • manage_search SKU-level detail: without additional analyst requests
  • lightbulb AI Insights (Executive Summary): generated by AI

Frequently asked questions

Q1 How did you reduce report time from 6 hours to 3 seconds?
The system eliminates manual work entirely: 900+ lines of logic automatically categorize products across 26 SKU attributes, fuzzy matching normalizes names with 99% accuracy, and streaming parsing processes 10,000+ Excel rows directly in the browser in under 2 seconds.
Q2 Does the data leave the browser? How secure is it?
No, the data never leaves your browser. All processing is client-side — files are parsed using streaming methods directly in your browser. Only a request to the Google Gemini API for generating the text summary is sent to the server, but the raw data itself stays on your device.
Q3 What is fuzzy matching and why is it needed?
Fuzzy matching is an algorithm for approximate string comparison that recognizes corrupted and variant product names from Excel exports and maps them to the master catalog. Accuracy is 99%. This eliminates duplicates and reporting errors.
Q4 What does the AI component (Google Gemini) do?
Google Gemini Pro generates a text-based Executive Summary from the processed data — highlighting bestsellers, anomalous sales drops, and returns. It's a ready-made analytical report for the CEO.
Q5 What data formats are supported?
The system accepts Excel (XLSX), XML, and CSV files. Parsing is performed using streaming methods — even files with tens of thousands of rows are processed without delays and without uploading to a server.
Q6 How long does implementation take?
From 3 weeks. The main effort is adapting the 900+ lines of categorization logic to each client's specific product nomenclature (SKU). Every project is unique because every business has its own product structure.
rocket_launch Ready Business Solution

Your sales analytics should be
just as autonomous.

  • check Integration of corporate data (XML/CSV/XLS)
  • check Confidentiality preservation (Client-Side)
  • check AI adaptation to your SKU catalog
  • check Minimization of analysts' routine work
Back to cases

Launch time — from 3 weeks. Custom built for your needs.

Other Cases